Gait Plots

Before running any commands, be sure your virtual python environment is activated. Type activate pycgm39copy

To find out the different plot commands, type

pycgm2.exe NEXUS Plots -h
copy

nexusPlotCommands

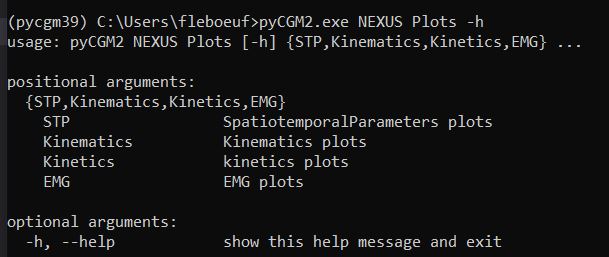
This flowchart describes the different scenario and available plot commands. For instances, you can plot time normalized kinematic either after loading your trial into nexus or marked serveral trials in the vicon eclipse data manager. The comparison plot only traces data from 2 eclipse-marked trials.

except temporal representation, all commands require you previously identified gait events

Reaction

Kinetics

Kinematics

command

command

command

command

command

command

command

command

command

MouvementAmbulationProfile

pycgm2.exe NEXUS Plots MAP

SpatioTemporal

pycgm2.exe NEXUS Plots STP

load a gait trial with model outputs

marked two gait trials \n in eclipse

marked n gait trials \n in eclipse

temporal representation

pycgm2.exe NEXUS Plots Kinematics Temporal

Time-Normalized representation

pycgm2.exe NEXUS Plots Kinematics Normalized

Comparison

pycgm2.exe NEXUS Plots Kinematics Comparison

temporal representation

pycgm2.exe NEXUS Plots Kinetics Temporal

Time-Normalized representation

pycgm2.exe NEXUS Plots Kinetics Normalized

Comparison

pycgm2.exe NEXUS Plots Kinetics Comparison

temporal representation

pycgm2.exe NEXUS Plots Reaction Temporal

Time-Normalized representation

pycgm2.exe NEXUS Plots Reaction Normalized

Comparison

pycgm2.exe NEXUS Plots Reaction Comparison

To know input arguments

  • type pycgm2.exe NEXUS Plots Kinematics Normalized -hcopy
  • Refer to the documentation API